

Sales pipeline coverage is an important metric that tells us how well a sales team is doing. It’s all about the ratio between the total value of deals in the pipeline and the revenue goal. Think of it as a measure of how well a company’s pipeline is stocked with potential deals compared to what they want to achieve in terms of revenue.
To calculate pipeline coverage, you take the total value of the pipeline and divide it by the revenue target. The result is expressed as a percentage.
But why is pipeline coverage so crucial?
Having a healthy pipeline coverage helps with forecasting and predicting future revenue. When the coverage percentage is high, it means there are enough potential deals in the pipeline to meet or even surpass the revenue goal. On the flip side, if the coverage percentage is low, it’s a sign that sales teams need to take action to fill the gap. They might need to focus on lead generation, prospecting, or speeding up the deal process.
By maintaining optimal pipeline coverage, companies ensure a steady flow of revenue and stay on top of any challenges that might come their way.
Below you’ll find 15 interesting statistics about sales pipeline coverage.
15 Interesting sales pipeline coverage statistics
Sales Pipeline Coverage Statistics: Sales Cycle Overview
- On average, the sales cycle lasts anywhere from about three months up to a year according to Lusha.
- Hubspot states that 37% of marketers claim the most challenging part of their job is prospecting.

- Salespeople spend about six hours each week researching prospects according to Crunchbase.
- Outreach.io shares that only 21% of MQLs are also SQLs.
- About half of sales go to the vendor that responds first according to Insider Sales.
- A Harvard Business review study found that firms who tried to contact a lead within an hour of receiving a query were nearly seven times more likely to close the sale.
Sales Pipeline Coverage Statistics: Revenue
- According to Forbes, organizations with accurate sales pipelines are 10% more likely to grow their revenue year over year.
- Companies that automate their lead management process see a 10% or more bump in revenue within six to nine months according to Bank Bound.
- There is a difference of nearly 30% revenue growth between companies that defined a formal sales process and companies that didn’t according to the Harvard Business Review.
- Hubspot shares that organizations that effectively manage their sales pipelines have a 28% higher revenue growth rate.
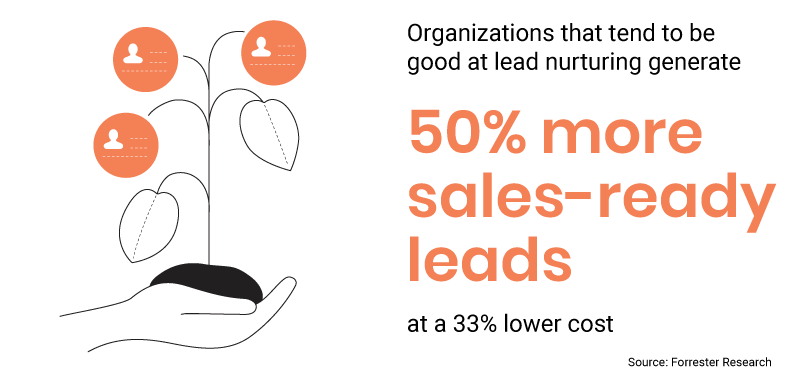
- Forrester Research stated that organizations that tend to be good at lead nurturing generate 50% more sales-ready leads at a 33% lower cost.
- Nearly half of all under-performing organizations have non-existent or informal sales processes according to Harvard Business Review.
Sales Pipeline Coverage Statistics: Lead Management
- Nearly ¼ of all organizations don’t even respond to their leads according to AutoGrow.
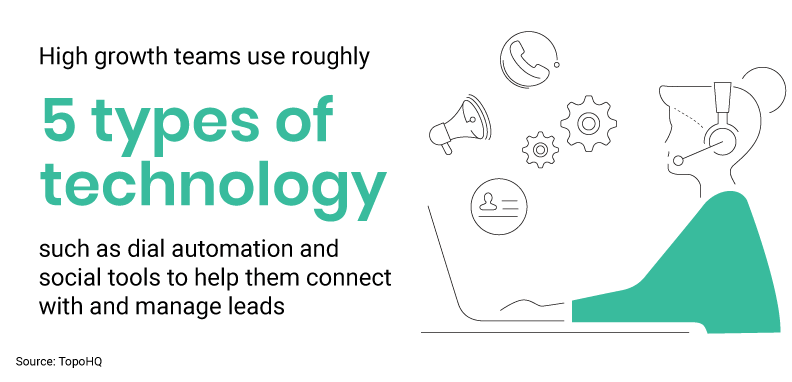
- High growth teams use roughly five types of technology such as dial automation and social tools to help them connect with and manage leads according to TopoHQ.
- According to LinkedIn, use of a CRM can increase your sales by 29%, sales productivity by 34%, and forecast accuracy by 42%.
Final Thoughts
Sales pipeline coverage is more than just a number. It’s a crucial metric that empowers businesses to navigate the complex landscape of sales. By providing a forward-looking perspective, it enables proactive decision-making and fosters adaptability in the ever-changing marketplace.
Understanding and optimizing this metric is key for organizations to not only meet immediate revenue goals but also lay a foundation for sustained success. It’s an excellent indicator of sales health that guides teams toward strategic resource allocation and keeps them ahead of industry shifts.